Unity
Performance Optimization Tools
By Circlesgames(assets department)
$99
Rated 0.0/5 from 1 ratings on Unity.
Price history
Recorded standalone sale prices and the latest available store price, in USD. Historical dots use the sale start date and its recorded offer price. Prices can change during a sale; this is not a daily price log. Bundle prices and upcoming offers are excluded. History covers up to the 100 most recent recorded offers.
Lowest recorded standalone price in this history: $49.50. The latest store price is $99.
View 4 recorded prices
| Sale start / price check | Price | Observation |
|---|---|---|
| $99 | Latest store price | |
| $99 | Unity First Price 2026-08-14 2026-08-14 | |
| $49.50 | Unity New Release Discount 2026-08-14 2026-08-28 | |
| $49.50 | Unity New Release Discount 2026-08-14 2026-08-28 |
Sale and bundle history
The 3 most recent recorded offers including this asset. Past offers may no longer be available. Bundle prices cover a package, not this asset alone.
About Performance Optimization Tools
- Tools, Systems & Learning > Development Tools & Automation
Looking for FAQ
Your game runs fine on your machine.
Then it's on someone's phone, or an older laptop, and things fall apart.
Maybe it's a 4K texture sitting on a tiny prop, quietly eating memory it doesn't need. Maybe a 50MB audio clip is decompressing into 200MB of RAM the moment it plays. Maybe a mesh with 50,000 triangles has no LOD, so it costs the same whether it's five feet away or fifty. Maybe a VR headset is overheating mid-session and the OS itself cuts your framerate in half without warning. Or maybe it's something you'd never spot by eye — a shader keyword nobody remembers enabling, or a hierarchy so deep every transform update cascades into the next one.
Normally you'd find these the hard way: change something, glance at the framerate for five seconds, and hope. That's not proof, that's a guess — background editor overhead and thermal drift alone can make a bad fix look like a good one.
(a solo/indie dev without deep profiling experience, doing their first real optimization pass before a release.
Manually, for that person, a real pass looks like: opening the Profiler and squinting at graphs without knowing what's normal, going asset-by-asset through hundreds or thousands of textures/meshes by eye (the docs themselves note scanning 10,000+ assets by hand is what "freezes the editor for minutes" even for the tool — doing it manually one by one is worse), building and pushing to a phone, playing, guessing, changing one thing, and repeating that loop for days because there's no way to confirm a fix actually helped without redoing the whole loop again. For someone learning as they go, that's realistically a weekend or more — and it's common for that weekend to end with "it feels a bit better" rather than a real answer.
With the scan-diagnose-fix-verify loop, What normally eats a weekend of guesswork — profiling by feel, rebuilding, testing on a phone, hoping — turns into an afternoon of following a clear list of exactly what to fix and proof that it worked.)
Where the time actually goes back to you: scanning a large project by hand for problems like this is normally a multi-hour hunt across dozens of asset types, and testing whether a fix actually worked usually means manually rebuilding and playtesting on multiple devices over and over. This kit turns that into one pass — the scan finds the specific problem objects for you, and the session recorder + regression checker tell you the real before/after numbers instead of you re-testing blind. One concrete example already built in: the texture atlasing tool alone can cut draw call batches by up to 70% in forward rendering, automatically — work that would otherwise mean manually repacking materials one by one.
It also saves you from the scariest part of optimization: touching something and not being able to undo it. It can snapshot your project before any risky change, so a bad fix is a one-click undo, not a lost afternoon.
You don't need to already know what a draw call or a shader keyword is to use this — it explains what it found in plain language. If you already live in the Unity Profiler every day, everything is still exposed for direct, granular use.
What you can do with it:
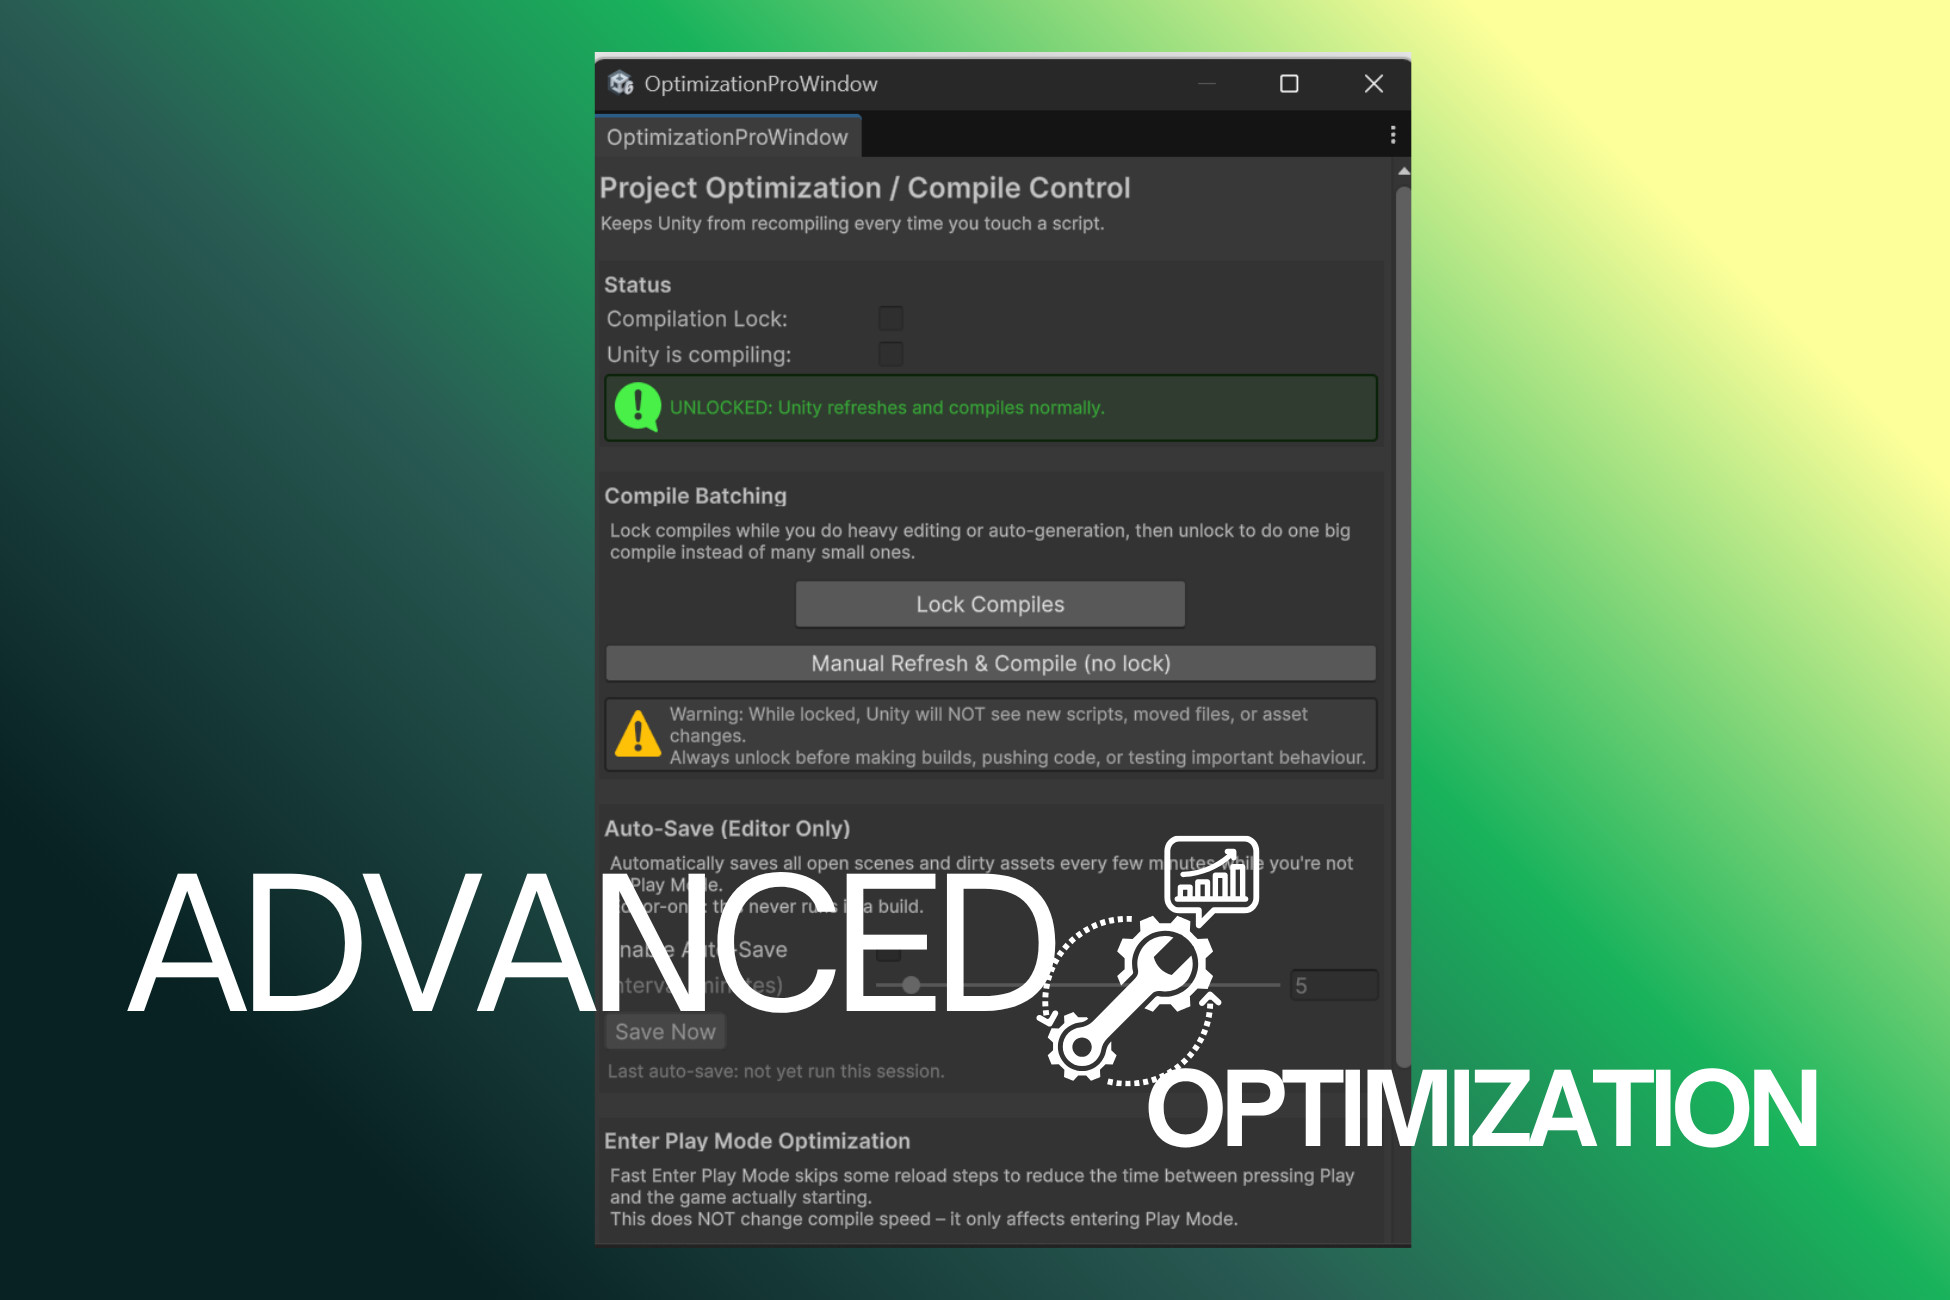
- Back up your entire project before any risky change, so you can undo instantly if something breaks
- Scan every texture, mesh, audio clip, shader, material, physics object, and hierarchy layer and see exactly what's costing performance and why
- Catch an oversized texture, a decompressing audio clip, or a high-poly mesh with no LOD before it ever ships
- Automatically hide, pause, or unload things the player can't see or hear — objects out of view, audio out of range, whole sections of a large world — so you're never spending performance on what nobody's experiencing
- Visualize overdraw and shader cost directly in the editor with a color-coded view, so expensive areas are obvious at a glance instead of guessed at
- Auto-generate distance-based versions of your models and combine small textures into one sheet, cutting draw calls automatically
- Generate ready-made quality presets for mobile, console, PC, and VR instead of hand-tuning each one, and wire them straight into an in-game settings menu
- Let quality adjust live while the game is running — resolution, shadows, effects — so a low-end phone and a gaming PC each get a version that fits them, automatically
- Catch a VR or mobile device overheating before the hardware itself slashes your framerate, and ease off gracefully instead
- Watch memory in real time and get warned before a slow leak turns into a crash
- Get your project's issues automatically re-prioritized based on your actual game — what matters for a mobile puzzle game is different from what matters for a PC open-world RPG, and it knows the difference
- Run a real gameplay session and see exactly where and when a stutter or spike happens, instead of never being able to reproduce it
- Compare a "before" and "after" session and get the real percentage improvement — not a guess
- Analyze your finished build to see exactly which textures, meshes, or audio files are bloating its size
- Auto-select the right quality tier for a player's hardware the first time they launch the game
- Export a clear report — for yourself, a teammate, or a publisher
Your game runs fine on your machine.
Then it's on someone's phone, or an older laptop, and things fall apart.
Maybe it's a 4K texture sitting on a tiny prop, quietly eating memory it doesn't need. Maybe a 50MB audio clip is decompressing into 200MB of RAM the moment it plays. Maybe a mesh with 50,000 triangles has no LOD, so it costs the same whether it's five feet away or fifty. Maybe a VR headset is overheating mid-session and the OS itself cuts your framerate in half without warning. Or maybe it's something you'd never spot by eye — a shader keyword nobody remembers enabling, or a hierarchy so deep every transform update cascades into the next one.
Normally you'd find these the hard way: change something, glance at the framerate for five seconds, and hope. That's not proof, that's a guess — background editor overhead and thermal drift alone can make a bad fix look like a good one.
(a solo/indie dev without deep profiling experience, doing their first real optimization pass before a release.
Manually, for that person, a real pass looks like: opening the Profiler and squinting at graphs without knowing what's normal, going asset-by-asset through hundreds or thousands of textures/meshes by eye (the docs themselves note scanning 10,000+ assets by hand is what "freezes the editor for minutes" even for the tool — doing it manually one by one is worse), building and pushing to a phone, playing, guessing, changing one thing, and repeating that loop for days because there's no way to confirm a fix actually helped without redoing the whole loop again. For someone learning as they go, that's realistically a weekend or more — and it's common for that weekend to end with "it feels a bit better" rather than a real answer.
With the scan-diagnose-fix-verify loop, What normally eats a weekend of guesswork — profiling by feel, rebuilding, testing on a phone, hoping — turns into an afternoon of following a clear list of exactly what to fix and proof that it worked.)
Where the time actually goes back to you: scanning a large project by hand for problems like this is normally a multi-hour hunt across dozens of asset types, and testing whether a fix actually worked usually means manually rebuilding and playtesting on multiple devices over and over. This kit turns that into one pass — the scan finds the specific problem objects for you, and the session recorder + regression checker tell you the real before/after numbers instead of you re-testing blind. One concrete example already built in: the texture atlasing tool alone can cut draw call batches by up to 70% in forward rendering, automatically — work that would otherwise mean manually repacking materials one by one.
It also saves you from the scariest part of optimization: touching something and not being able to undo it. It can snapshot your project before any risky change, so a bad fix is a one-click undo, not a lost afternoon.
You don't need to already know what a draw call or a shader keyword is to use this — it explains what it found in plain language. If you already live in the Unity Profiler every day, everything is still exposed for direct, granular use.
What you can do with it:
- Back up your entire project before any risky change, so you can undo instantly if something breaks
- Scan every texture, mesh, audio clip, shader, material, physics object, and hierarchy layer and see exactly what's costing performance and why
- Catch an oversized texture, a decompressing audio clip, or a high-poly mesh with no LOD before it ever ships
- Automatically hide, pause, or unload things the player can't see or hear — objects out of view, audio out of range, whole sections of a large world — so you're never spending performance on what nobody's experiencing
- Visualize overdraw and shader cost directly in the editor with a color-coded view, so expensive areas are obvious at a glance instead of guessed at
- Auto-generate distance-based versions of your models and combine small textures into one sheet, cutting draw calls automatically
- Generate ready-made quality presets for mobile, console, PC, and VR instead of hand-tuning each one, and wire them straight into an in-game settings menu
- Let quality adjust live while the game is running — resolution, shadows, effects — so a low-end phone and a gaming PC each get a version that fits them, automatically
- Catch a VR or mobile device overheating before the hardware itself slashes your framerate, and ease off gracefully instead
- Watch memory in real time and get warned before a slow leak turns into a crash
- Get your project's issues automatically re-prioritized based on your actual game — what matters for a mobile puzzle game is different from what matters for a PC open-world RPG, and it knows the difference
- Run a real gameplay session and see exactly where and when a stutter or spike happens, instead of never being able to reproduce it
- Compare a "before" and "after" session and get the real percentage improvement — not a guess
- Analyze your finished build to see exactly which textures, meshes, or audio files are bloating its size
- Auto-select the right quality tier for a player's hardware the first time they launch the game
- Export a clear report — for yourself, a teammate, or a publisher