Price history
Recorded standalone sale prices and the latest available store price, in USD. Historical dots use the sale start date and its recorded offer price. Prices can change during a sale; this is not a daily price log. Bundle prices and upcoming offers are excluded. History covers up to the 100 most recent recorded offers.
Lowest recorded standalone price in this history: $19.98. The latest store price is $19.99.
View 2 recorded prices
| Sale start / price check | Price | Observation |
|---|---|---|
| $19.99 | Latest store price | |
| $19.98 | Unity First Price 2026-09-21 2026-09-21 |
Sale and bundle history
The 1 most recent recorded offers including this asset. Past offers may no longer be available. Bundle prices cover a package, not this asset alone.
About Interactive Charts & Graphs Toolkit
- Tools, Systems & Learning > Development Tools & Automation
- Art & Visuals > UI & GUI
Build polished, animated, and interactive charts directly inside Unity UI Toolkit with the Interactive Charts & Graphs Toolkit.
Designed for both developers and designers, the toolkit provides two flexible workflows: create charts through a fluent runtime API in code, or design them visually in the Editor using ChartPreviewAsset and render them at runtime.
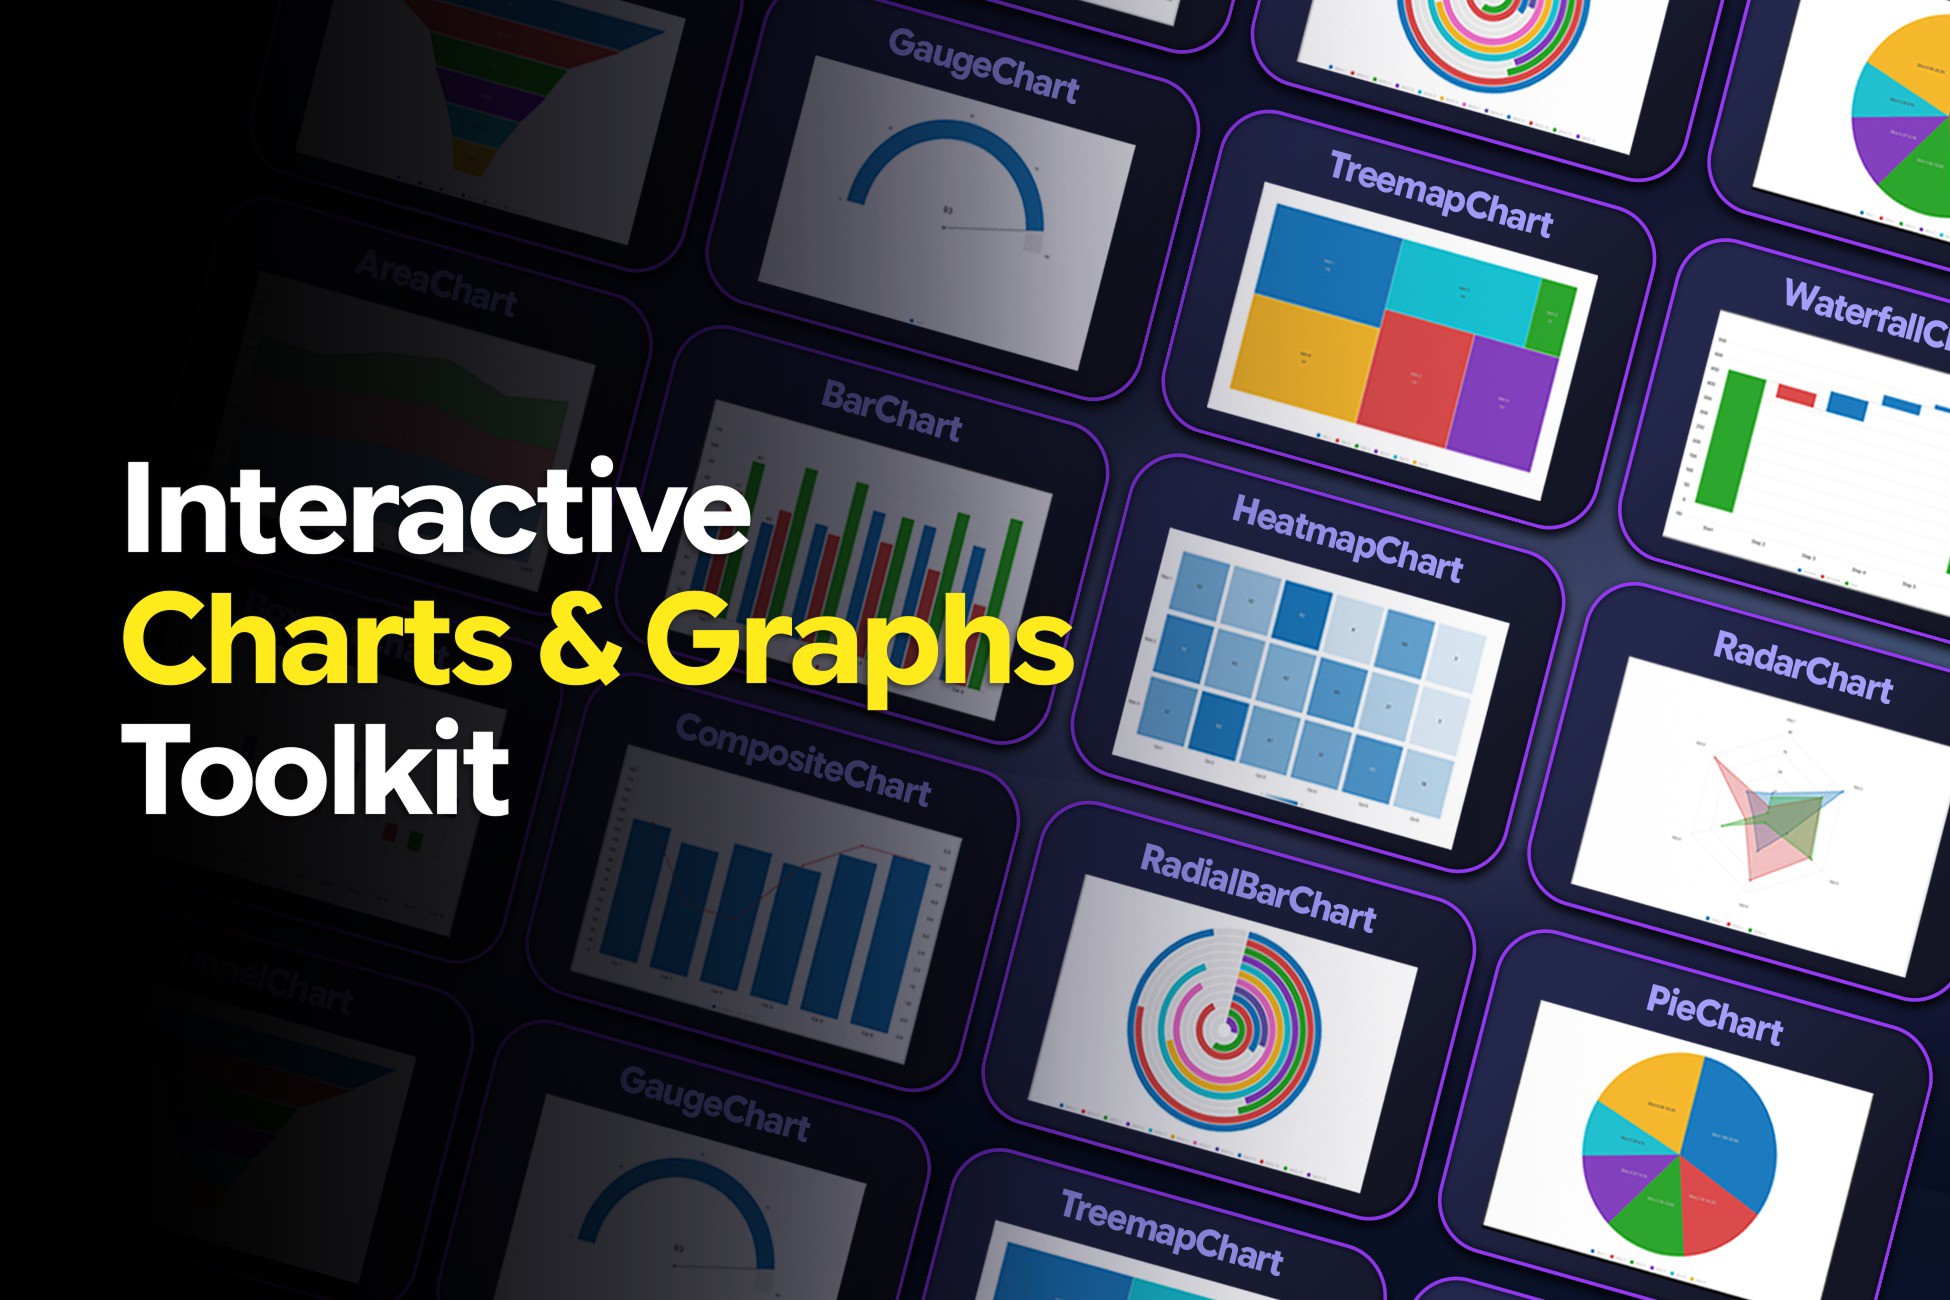
Choose from 16 chart types with shared support for themes, animations, legends, tooltips, hover interactions, value labels, hit-testing, and customizable chart configurations.
Key Features
16 interactive chart types
Code-first Fluent Chart API
Visual Editor workflow with live preview
Runtime chart creation and updates
ChartPreviewAsset workflow
Custom themes and reusable ChartThemeAsset assets
Built-in Light, Dark, Pastel, Midnight, Corporate, and Sunset themes
Animated value transitions
Interactive hover effects
Legends with visibility toggling
Customizable tooltips
Value labels
Runtime point addition, updates, replacement, and removal
Rolling data windows for live charts
CSV data import and export
JSON data import and export
PNG chart export
Sample chart assets
Demo scenes
Runtime demo scripts
No third-party dependencies
Included Chart Types
Line
Bar
Area
Pie
Radar
Scatter
Composite
Heatmap
Funnel
Gauge
Waterfall
Treemap
Candlestick
Bullet
Box Plot
Radial Bar
Editor Workflow
Use the dedicated Interactive Charts & Graphs Toolkit window to build and preview charts without manually creating the chart UI.
The Editor provides:
Chart type selection
Data Editor
CSV / JSON import
Sample data generation
Series and point editing
Chart-specific configuration
Legend and tooltip configuration
Theme editing
Built-in theme presets
Live chart preview
JSON / CSV export
PNG export
Save and Duplicate workflows for ChartPreviewAsset assets
Runtime Workflow
Create charts directly from code using the fluent Chart API, or render charts that were designed in the Editor through ChartPreviewAsset.CreateElement().
RuntimeChart provides convenient methods for updating live data, including:
AddPoint
UpdatePoint
RemovePointAt
RemoveLast
ReplacePoints
Clear
Runtime PNG export
This makes the toolkit suitable for live dashboards, telemetry displays, dynamically changing datasets, and other runtime data visualization interfaces.
Designed for both developers and designers, the toolkit provides two flexible workflows: create charts through a fluent runtime API in code, or design them visually in the Editor using ChartPreviewAsset and render them at runtime.
Choose from 16 chart types with shared support for themes, animations, legends, tooltips, hover interactions, value labels, hit-testing, and customizable chart configurations.
Key Features
16 interactive chart types
Code-first Fluent Chart API
Visual Editor workflow with live preview
Runtime chart creation and updates
ChartPreviewAsset workflow
Custom themes and reusable ChartThemeAsset assets
Built-in Light, Dark, Pastel, Midnight, Corporate, and Sunset themes
Animated value transitions
Interactive hover effects
Legends with visibility toggling
Customizable tooltips
Value labels
Runtime point addition, updates, replacement, and removal
Rolling data windows for live charts
CSV data import and export
JSON data import and export
PNG chart export
Sample chart assets
Demo scenes
Runtime demo scripts
No third-party dependencies
Included Chart Types
Line
Bar
Area
Pie
Radar
Scatter
Composite
Heatmap
Funnel
Gauge
Waterfall
Treemap
Candlestick
Bullet
Box Plot
Radial Bar
Editor Workflow
Use the dedicated Interactive Charts & Graphs Toolkit window to build and preview charts without manually creating the chart UI.
The Editor provides:
Chart type selection
Data Editor
CSV / JSON import
Sample data generation
Series and point editing
Chart-specific configuration
Legend and tooltip configuration
Theme editing
Built-in theme presets
Live chart preview
JSON / CSV export
PNG export
Save and Duplicate workflows for ChartPreviewAsset assets
Runtime Workflow
Create charts directly from code using the fluent Chart API, or render charts that were designed in the Editor through ChartPreviewAsset.CreateElement().
RuntimeChart provides convenient methods for updating live data, including:
AddPoint
UpdatePoint
RemovePointAt
RemoveLast
ReplacePoints
Clear
Runtime PNG export
This makes the toolkit suitable for live dashboards, telemetry displays, dynamically changing datasets, and other runtime data visualization interfaces.